







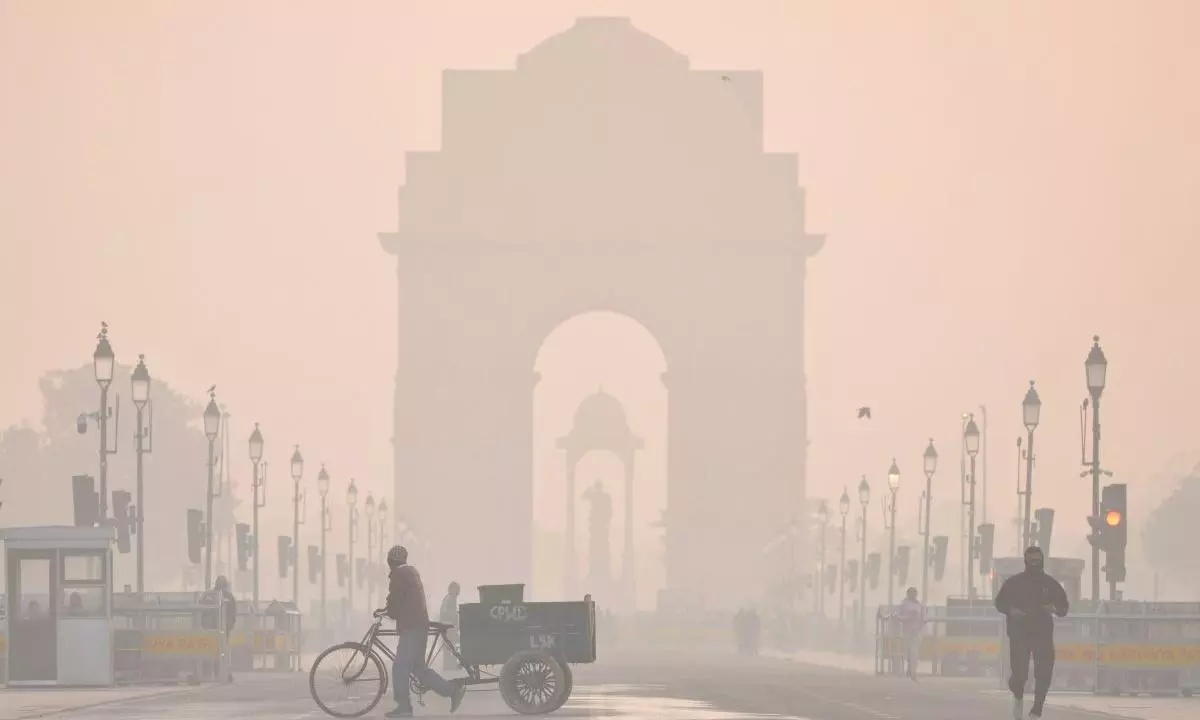
Post-Diwali pollution: Delhi records 'severe' AQI, Chennai's in 'poor' category at 206
Delhi recorded 'severe' air quality at several monitoring stations after Diwali, while Chennai, Mumbai, Bengaluru and Kolkata reported comparatively lower pollution levels

India's major cities woke up to varying levels of air pollution post-Diwali on November 9 morning, with Delhi recording a ‘severe’ air quality reading even as Chennai, Mumbai, Bengaluru and Kolkata remained in comparatively better categories.
Data from the Central Pollution Control Board (CPCB) dashboard at 6 am showed Delhi's city-level Air Quality Index (AQI) at 366, while readings at several monitoring stations in the national capital crossed 430.
Delhi worst-affected
Delhi was the worst-affected among the five cities. The CPCB dashboard recorded an AQI of 449 at Sonia Vihar, 439 at Jahangirpuri and 435 at Rohini. The city-level reading of 366 placed Delhi in the 'very poor' category, while the three among many more monitoring stations recorded 'severe' air quality.
Also read: Delhi firecracker ban ground report: Illegal sales thrive despite SC order
The high readings come amid concerns over firecracker use during Diwali. In several parts of Delhi, firecracker activity reportedly continued beyond 10 pm, the permitted time window. The resulting pollution adds to the city's existing winter air quality challenges.
Chennai's AQI in 'poor' category
Southern cities recorded relatively lower AQI readings. Chennai's city-level AQI stood at 206, with Arumbakkam recording 243 and Manali Village 269. The readings placed the city in the 'poor' category. Chennai also experienced rainfall through much of Sunday, which could help disperse pollutants and improve air quality.
Mumbai recorded a city-level AQI of 170. However, some monitoring stations reported higher readings, with Deonar at 221, Bandra-Kurla Complex at 224 and Kerwadi in Bandra East at 259.
Also read: Sky rockets, aerial firecrackers banned in Thane district after 11 fire incidents on Diwali
Bengaluru recorded the lowest city-level AQI among the five cities at 124. The City Railway Station monitoring station registered 217, while Silk Board recorded 146 and Hombegowda Nagar 129.
In Kolkata, the city-level AQI stood at 169. Among individual monitoring stations, Ballygunge recorded 185, Rabindra Bharati University area 182 and Fort William 183.
Why some AQI data gives scores above 1,000
Different air quality indices use different scales, which explains why some platforms report readings exceeding 1,000 while the CPCB dashboard does not.
India's national AQI system has a scale ranging from zero to 500. The highest category, 'severe', covers readings between 401 and 500. The scale is capped at 500, meaning that even when pollution levels rise further, the reported AQI does not necessarily increase beyond this limit.
Other systems, including the US Environmental Protection Agency's AQI framework, use different calculation methods and scales. Some alternative reporting systems also provide extended or uncapped readings, which can result in scores above 1,000.
Also read: Indian cities dominate world’s most-polluted 150 on Diwali evening; 6 cross AQI 1000
However, a reading of 500 or 1,200 indicates extremely hazardous air quality, even though the numbers cannot be directly compared across different AQI systems.
PM2.5 pollution
A more useful way to understand the health risks is to examine the concentration of fine particulate matter, particularly PM2.5, measured in micrograms per cubic metre (µg/m³). These particles are small enough to penetrate deep into the lungs and can enter the bloodstream.
Under India's national standards, the 24-hour permissible limit for PM2.5 is 60 µg/m³, while the World Health Organisation recommends a much lower limit of 15 µg/m³. Concentrations above these thresholds pose increasing health risks, particularly for children, older people and those with respiratory conditions.
The CPCB dashboard and the government's SAMEER mobile application provide PM2.5 and PM10 concentration readings alongside AQI data, offering a clearer picture of the pollution burden.